
Student's Grade Analysis
- Aroyewun Airat
- May 6, 2023
- 6 min read

Updated: Oct 20, 2023
For this project, I served as a Recruitment analyst for an Online Business School that's looking to disrupt the post-graduate programs offered by traditional universities. I was provided with the data from the first graduating class of the MBA program, including details and scores from their application, the program itself, and their employment status 2 months later. I will discuss more of the dataset later in this article. My goal as the recruitment analyst is to evaluate the results of the present class, predict the performance of future students, and propose changes in recruitment to improve graduate outcomes.

Metadata
The table contains the following columns:
* Student ID - A unique identifier for each student.
* Undergrade Degree - The student's undergrad degree.
* Undergrad Grade - The student’s final grade average from their undergraduate degree (0-100).
* MBA Grade - The student’s final grade average from our master’s degree program (0-100).
* Work Experience - The student’s final grade average from our master’s degree program (0-100).
* Employability before - The student’s score from a third-party test that measures their appeal to employers in selected industries, taken during their admissions process (0-500).
* Employability After - The student’s score from the same test, taken after obtaining their Master’s.
* Status - Indicator of the student’s employment status (Placed/Not Placed).
* Annual Salary - The student’s annual salary (USD).
The tool used for the analysis
I used Microsoft Excel for the course of this project.
I was directed to provide answers to the following requests;
The following are the requests from Molly(the director of education)
Request 1:
I need to get a clear picture of students' MBA grade averages to see if I need to make any tweaks to the program's curriculum. What was the final grade average for our MBA graduates?
Analysis and Conclusion:
I created a frequency table grouping the data from 600 to 100 by 5. After creating a frequency table.

I visualized a histogram to view the distribution of the student's MBA scores. From the chart, I could tell that the data is normally distributed having just a few students scoring above 90. Most of the students scored between the range of 80-85.

I went ahead to test the hypothesis to check if there is less than a 20% chance of 80 being the real MBA grade average with the current curriculum. Setting the significance level as 0.2, after the analysis of the p-value(probability that the sample supports the null hypothesis) being 0.790.

My conclusion went as thus, since the P-value is greater than the significant value, we don't have sufficient knowledge to prove that the average MBA score is any different from our assumption. therefore our assumption is correct.
Request 2:
I wonder if, since this is a Master in Business Administration, Business Undergrads tend to do better than others. Could you give me a quick summary that shows the average MBA grades for Business Undergrads vs. Other Undergrads? I'd appreciate it if you could interpret the results for me as well.
Did business school achieve higher MBA grades compared to the others?
Analysis and conclusion:
I went ahead to create a statistical analysis to see if the Business Undergrad scores more grades compared to other undergrads. I calculated the count, mean, median, mode, and Skew of both the business undergrads and Other undergrads. Since the median of the business students and other students is quite similar(Business students:80.6, Other students: 80.0) I can deduce that half of the students scored above 80 and the others scored below 80. Since the mean of business undergrads is slightly higher than the median and the skew(0.288) is positive I concluded that Business students do tail off towards the higher scores from the middle value(80).

Request 3:
I keep thinking about the possibilities now that we know the grade averages for our graduates follow a normal distribution. For example, I'd love to consider anyone that graduates with an average of 90 or higher an "honor student".
What would be the probability of someone getting that grade? I'd hate for it to be more than 10% of students. What is the probability of an MBA student getting a final grade above 90 or higher?
Analysis and Conclusion:
I used the NORM.DIST function to calculate the probability of getting an MBA score of 90. There's a 5.56% chance of getting an MBA score of 90.

Request 4:
I’ll stick with 90 as the threshold for honor students. What grade would put students in the top 10% of the class? And how many standard deviations away from the average student would that be?
Analysis and conclusion:
I calculated this using the NORM.INV function. After analysis, my conclusion is that to be amongst the top 10 students one must score at least 88.1.

Request 5:
What is the mean employability score to expect from our future graduates with 90% confidence?
Analysis and conclusion:
I answered this question by calculating
- the sample size using the COUNT function
- the mean of the data using the AVERAGE function
- Critical value using NORM.S.INV function
- the Standard Error which is the Standard deviation over the square root of the sample size.
- the Margin of Error which is the multiplication of critical value and standard error.
- and finally, I went ahead to calculate the lower limit and upper limit.
After analysis, I conclude that "With 90% confidence that graduates from our program will achieve employability scores between 274.16 and 304.54 on average. Write questions and provide answers to them.

The following are the requests from Nick (head of student placement)
Request 1:
Could you predict graduate salaries?
Analysis and Conclusion:
Firstly, I conducted different tests to check if the Annual Salary column follows a normal distribution.
- I plotted a distribution of annual salary to see if it resembles a bell shape. From the chart, I could deduce that the graph wasn't normally distributed.
- I further went to check if the Mean and the Median are equal or similar, It didn't seem to follow a normal distribution.
- I took the final test to calculate the percentage of salaries that are 1, 2, and 3 standard deviations from the mean to see if the variables follow the empirical rule(68,95,99.7% rule). After conducting all these tests, I could say that the annual salary doesn't follow a normal distribution.

Request 2:
What is the mean annual salary we can expect from our future graduates?
Analysis and Conclusion:
I calculated the sample data(the sample size, the mean, and the standard deviation of the sample data). I calculated the margin of error using the CONFIDENCE.NORM function after setting the confidence level as 90%
- Finally calculated the lower and upper limits for the confidence interval by adding|subtracting the mean with|from the margin of error. Therefore we can say with 90% confidence that our graduates will earn a mean annual salary between $111,266 and $127,508.

Request 3:
Can I be 95% sure that over half of our placed graduates earn 6 digits?
Analysis and Conclusion:
I started by calculating the amount of placed graduates who earn at least $100,000. After that, I created a hypothesis test, setting 0.05 as the significance level. After analysis, the p-value was 0.016, We can therefore conclude that we have sufficient evidence to prove that the proportion of placed graduates that earn at least $100,000 is greater than 50%.

Request 4:
What percentage of graduates should we expect to land a job within, 2months of graduating?
Analysis and Conclusion:
Using the data provided, I calculated the sample proportion. I made sure to check if the central limit theorem applies to the dataset. I calculated the margin of error with a 95% confidence level. Finally, I calculated the confidence interval by adding|subtracting the sample proportion and|from the margin of error. Which left me with a value of 46%-66%. Therefore, I can conclude with 95%confidence that 46% - 66% of our graduates will land a job within 2 months after graduating.

Request 5:
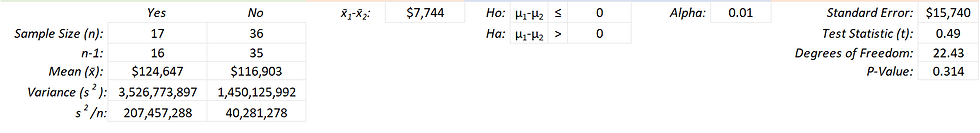
Can we prove with 99% certainty that graduates with previous work experience earn more on average than those without?
Analysis and Conclusion:
I created a hypothesis test; I calculated the point estimate by calculating the mean of students with previous work experience(X¹) from the mean of students without previous work experience(X²). I then set the significance level to 0.01 and calculated the P-value, after the analysis my conclusion follows as thus, since p>α, we don't have sufficient evidence to prove that graduates with previous work experience earn more money.
Comments